Top and Bottom chart-patterns
Top and bottom chart patterns are reversal formations that signal potential changes in market direction. A double or triple top forms after an uptrend when the price reaches a resistance level two or three times before reversing downward. Conversely, double or triple bottoms appear after a downtrend, where the price tests a support level multiple times before reversing upward. These patterns help traders anticipate trend reversals and identify entry or exit points in the market.
Trading Strategies
Triple Top Chart pattern
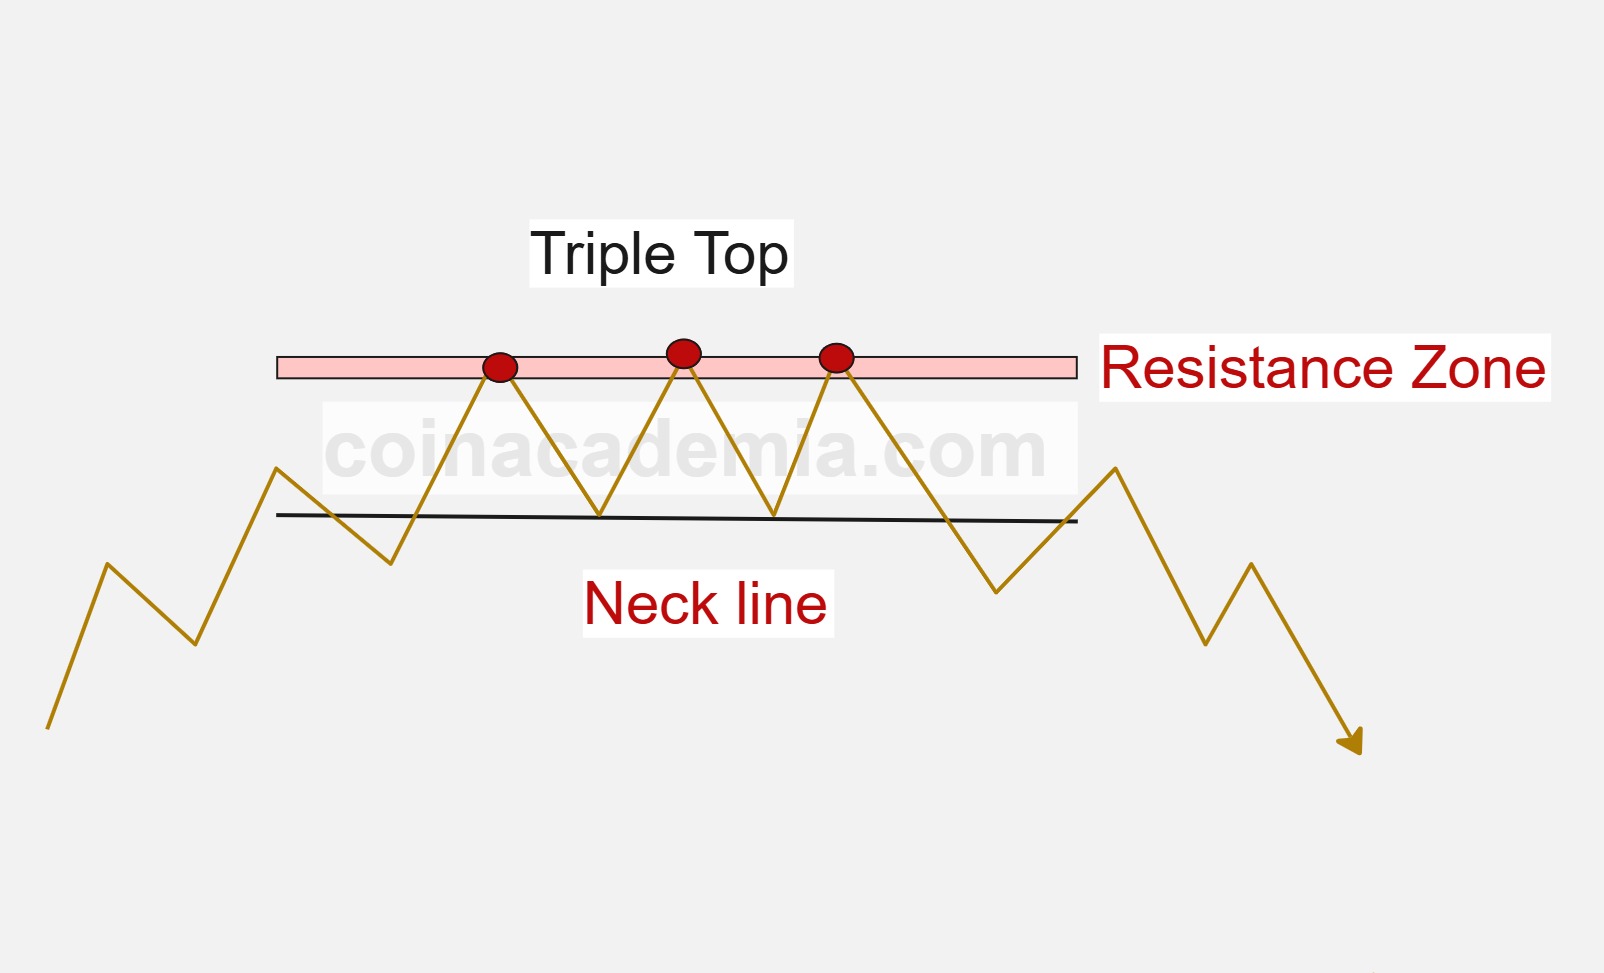
The triple top chart pattern is a bearish reversal formation that occurs after an uptrend. It consists of three distinct highs at approximately the same price level, indicating strong resistance. The pattern is confirmed when the price breaks below the support level formed by the lows between the tops.
Traders often look for confirmation of the pattern by waiting for a breakdown below the support level, which signals a potential trend reversal. This breakdown is typically accompanied by increased volume, indicating strong selling pressure.
Risk management is crucial when trading triple tops. Traders typically set stop-loss orders above the most recent swing high or the upper trendline to protect against false breakouts. Additionally, measuring the height of the pattern can help set profit targets, as the expected move after a breakdown is often equal to the height of the pattern subtracted from the breakdown point.
Understanding the psychology behind triple tops is important. The repeated highs indicate that buyers are struggling to push the price higher, while sellers are stepping in at the resistance level. This creates a strong foundation for a potential trend reversal, making triple tops a valuable tool for traders looking to capitalize on bearish market conditions.
Practicing the identification of triple top patterns on historical charts helps traders build confidence in their ability to recognize this formation and apply it effectively in their trading strategies.
In summary, the triple top chart pattern is a bearish reversal formation characterized by three peaks at similar price levels, signaling a potential trend reversal. Traders can use this pattern to identify entry and exit points, manage risk, and enhance their trading strategies.
Triple Bottom Chart Pattern
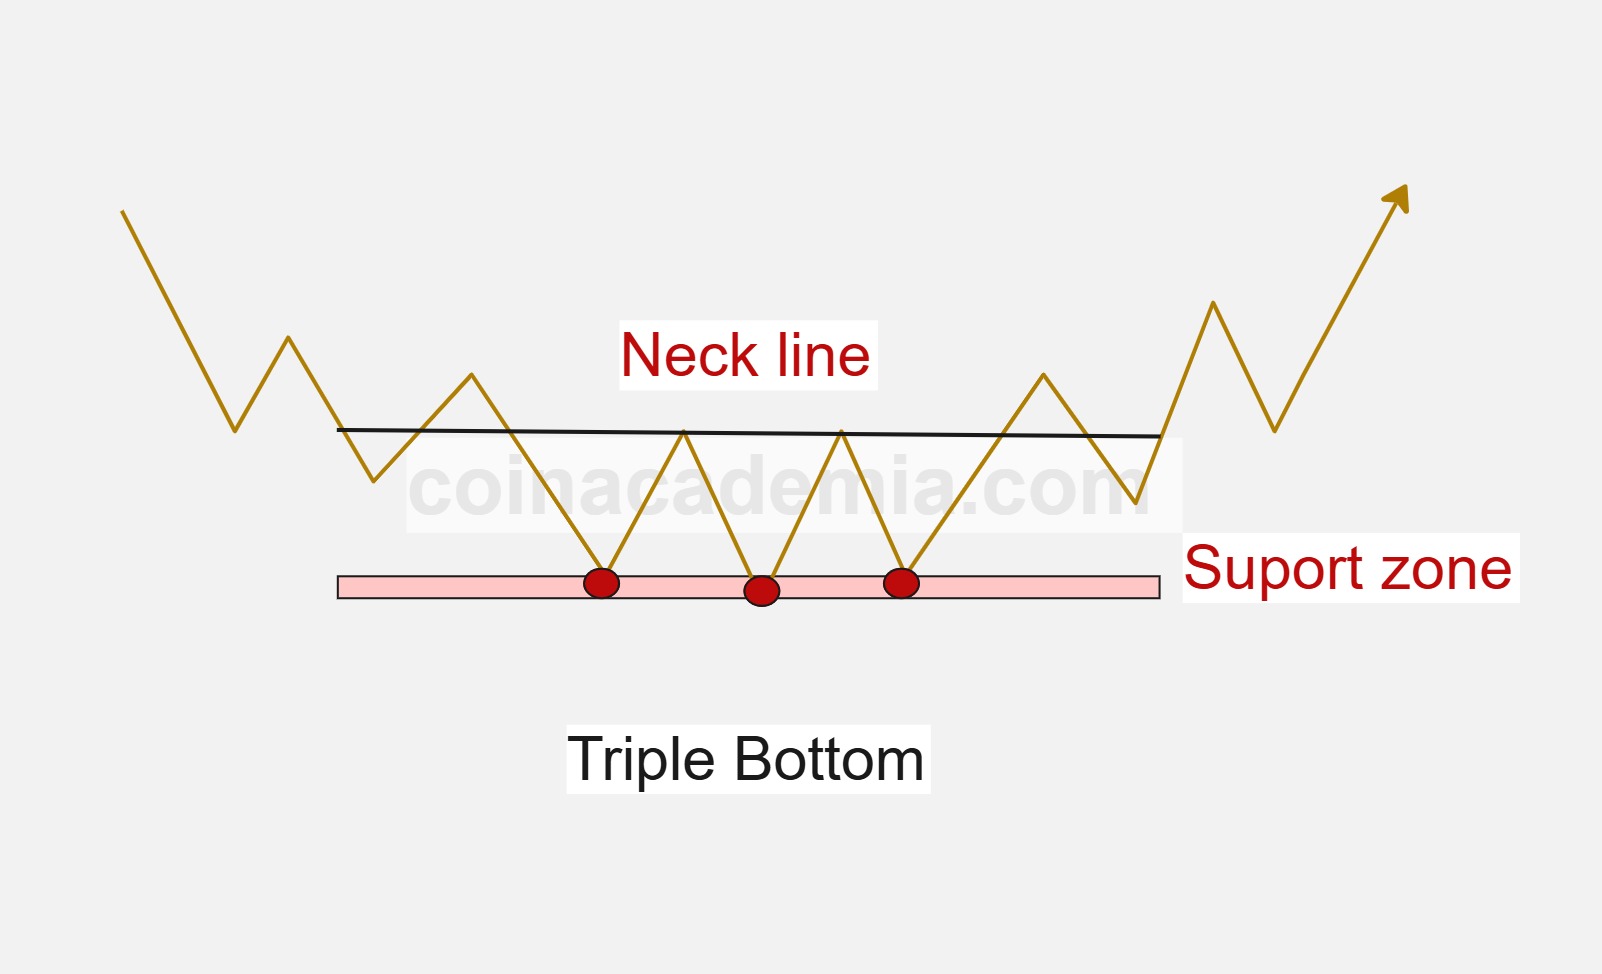
The triple bottom chart pattern is a bullish reversal formation that occurs after a downtrend. It consists of three distinct lows at approximately the same price level, indicating strong support. The pattern is confirmed when the price breaks above the resistance level formed by the highs between the bottoms.
A descending channel is a bearish chart pattern formed by drawing two parallel downward-sloping trendlines that connect a series of lower highs and lower lows. This pattern indicates a prevailing downtrend, where the price consistently makes lower highs and lower lows within the channel.
Traders often look for confirmation of the pattern by waiting for a breakdown below the lower trendline, which signals a continuation of the bearish trend. This breakdown is typically accompanied by increased volume, indicating strong selling pressure.
Risk management is crucial when trading descending channels. Traders typically set stop-loss orders above the most recent swing high or the upper trendline to protect against false breakouts. Additionally, measuring the height of the channel can help set profit targets, as the expected move after a breakdown is often equal to the height of the channel subtracted from the breakdown point.
Understanding the psychology behind descending channels is important. The repeated lower highs and lower lows indicate that sellers are in control, and buyers are unable to push the price higher. This creates a strong foundation for a potential continuation of the downtrend, making descending channels a valuable tool for traders looking to capitalize on bearish market conditions.
Practicing the identification of descending channel patterns on historical charts helps traders build confidence in their ability to recognize this formation and apply it effectively in their trading strategies.
Your Feedback
We value your feedback! Please share your thoughts or questions about this chart pattern. Feel free to leave a comment below, and we'll get back to you as soon as possible.
We appreciate your input and are here to help with any questions you may have.
About Us
Coin Academia is dedicated to providing the best resources for forex and cryptocurrency education and trading.


© 2025 Coin Academia. All rights reserved.