Pennants Chartpatterns
Pennants are short-term continuation chart patterns that form after a strong price movement, known as the flagpole. They are characterized by converging trendlines that resemble a small symmetrical triangle, with the price consolidating in a tight range. Pennants typically occur in both bullish and bearish markets, signaling a brief pause before the prevailing trend resumes.
Trading Strategies
Bullish Pennant
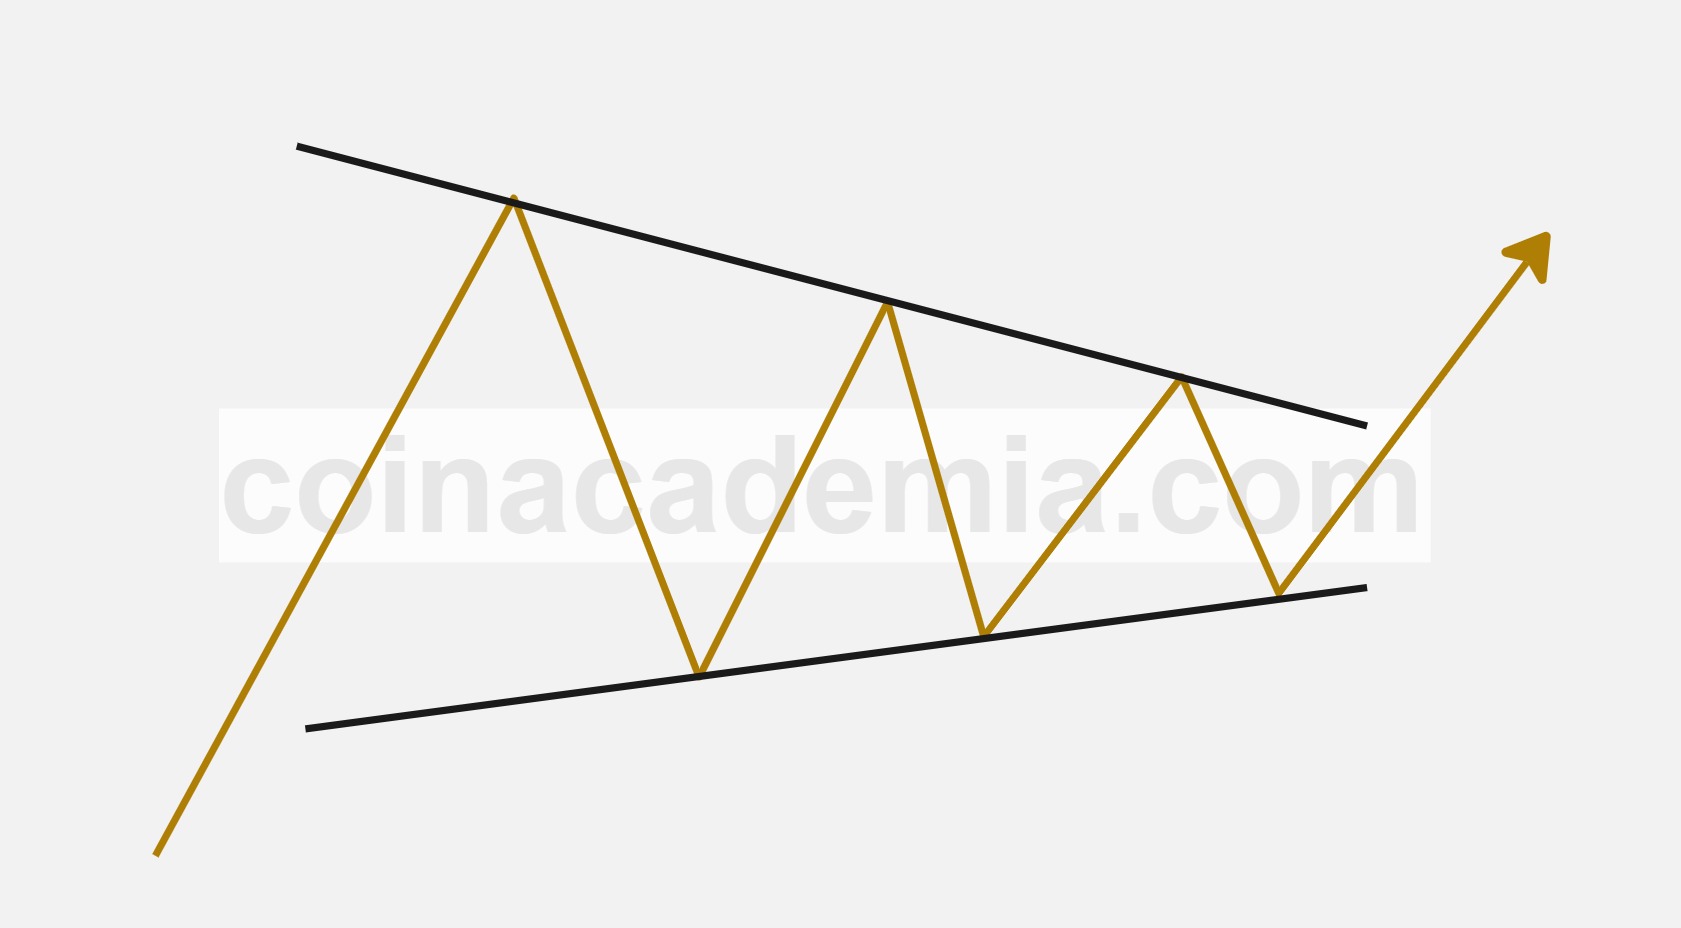
A bullish pennant is a continuation chart pattern that forms after a strong upward price movement, known as the flagpole. It is characterized by converging trendlines that create a small symmetrical triangle, indicating a period of consolidation before the price breaks out to the upside.
Traders often look for a breakout above the upper trendline of the pennant, which signals a continuation of the bullish trend. The breakout is typically accompanied by increased volume, confirming the strength of the move. The price target after the breakout can be estimated by measuring the height of the flagpole and adding it to the breakout point.
Risk management is crucial when trading bullish pennants. Traders often set stop-loss orders below the lower trendline of the pennant to protect against false breakouts. Additionally, monitoring volume during the breakout is essential, as a strong breakout with high volume increases the likelihood of a successful trade.
Understanding the psychology behind bullish pennants is important. The pattern indicates that buyers are in control, and the consolidation phase allows them to gather strength before pushing the price higher. This creates a favorable environment for traders looking to capitalize on the continuation of the bullish trend.
Practicing the identification of bullish pennant patterns on historical charts helps traders build confidence in their ability to recognize this formation and apply it effectively in their trading strategies.
In summary, bullish pennants are powerful continuation patterns that signal a potential breakout to the upside after a period of consolidation. By understanding the characteristics of this pattern and implementing effective trading strategies, traders can enhance their chances of success in the financial markets.
Bearish Pennant
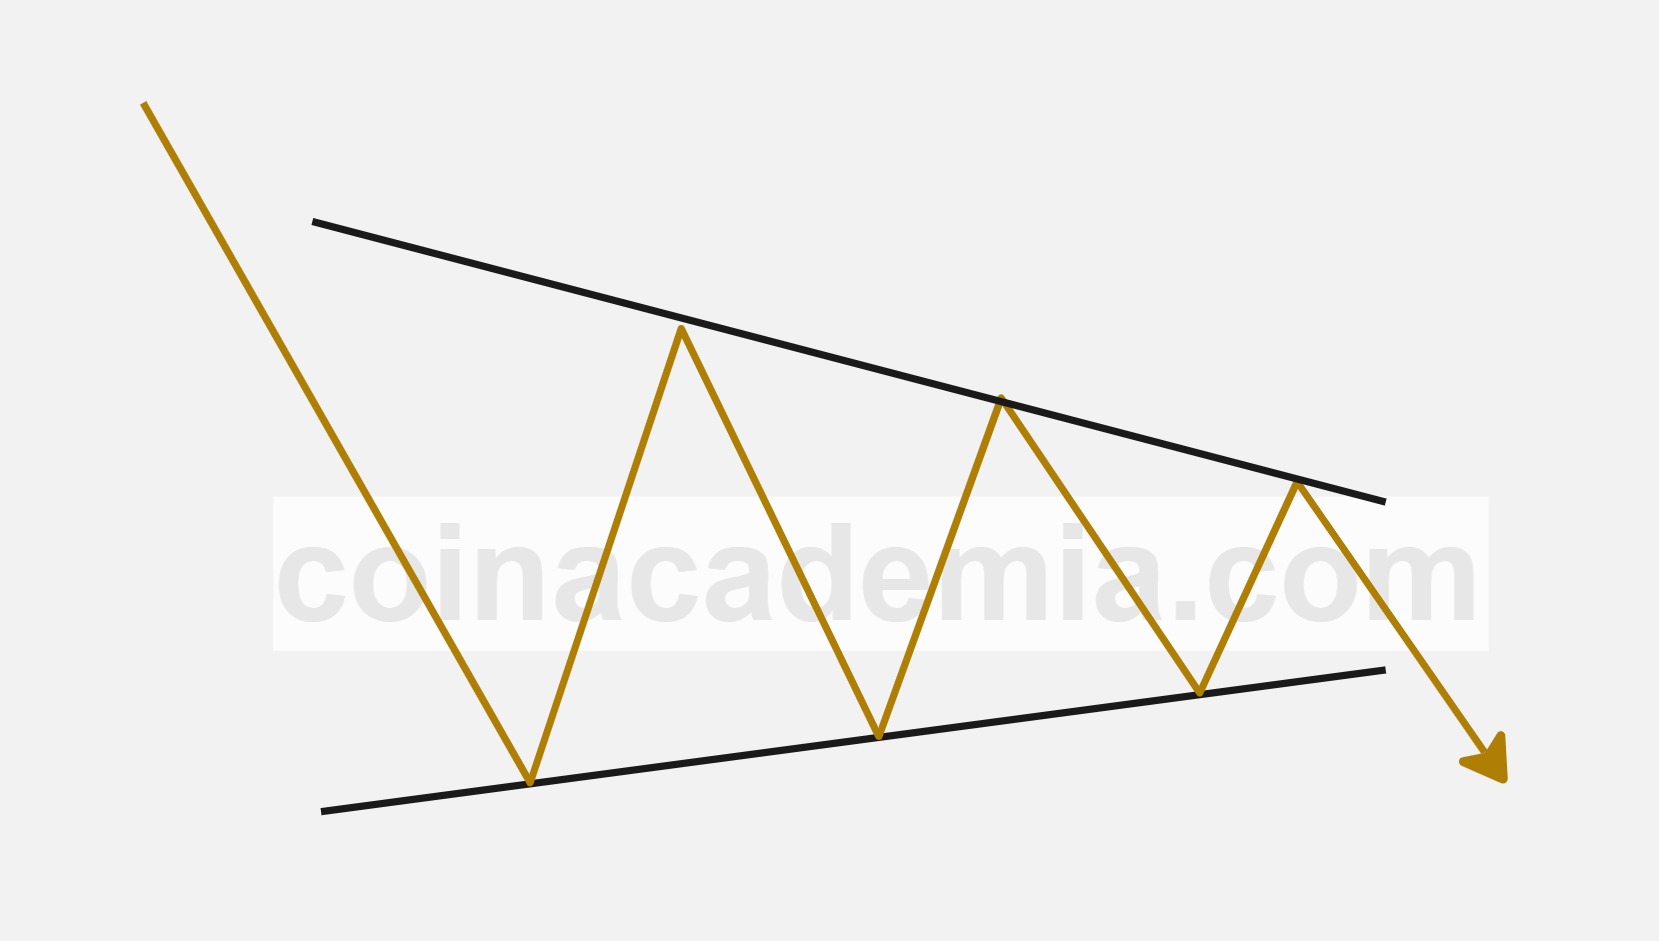
A bearish pennant is a continuation chart pattern that forms after a strong downward price movement, known as the flagpole. It is characterized by converging trendlines that create a small symmetrical triangle, indicating a period of consolidation before the price breaks out to the downside.
Traders often look for a breakout below the lower trendline of the pennant, which signals a continuation of the bearish trend. The breakout is typically accompanied by increased volume, confirming the strength of the move. The price target after the breakout can be estimated by measuring the height of the flagpole and subtracting it from the breakout point.
Risk management is crucial when trading bearish pennants. Traders often set stop-loss orders above the upper trendline of the pennant to protect against false breakouts. Additionally, monitoring volume during the breakout is essential, as a strong breakout with high volume increases the likelihood of a successful trade.
Understanding the psychology behind bearish pennants is important. The pattern indicates that sellers are in control, and the consolidation phase allows them to gather strength before pushing the price lower. This creates a favorable environment for traders looking to capitalize on the continuation of the bearish trend.
Practicing the identification of bearish pennant patterns on historical charts helps traders build confidence in their ability to recognize this formation and apply it effectively in their trading strategies.
In summary, bearish pennants are powerful continuation patterns that signal a potential breakout to the downside after a period of consolidation. By understanding the characteristics of this pattern and implementing effective trading strategies, traders can enhance their chances of success in the financial markets.
Your Feedback
We value your feedback! Please share your thoughts or questions about this chart pattern. Feel free to leave a comment below, and we'll get back to you as soon as possible.
We appreciate your input and are here to help with any questions you may have.
About Us
Coin Academia is dedicated to providing the best resources for forex and cryptocurrency education and trading.


© 2025 Coin Academia. All rights reserved.