Wedge chart-patterns
Wedge patterns are technical analysis chart formations that indicate a potential reversal or continuation of a trend. They are characterized by two converging trendlines, with the price action moving within the wedge shape. Wedges can be classified into three main types: Broadenib wedges, rising wedges and falling wedges.
Trading Strategies
Descending Broadening Wedge
A descending broadening wedge is a chart pattern characterized by two diverging trendlines, both sloping downward and spreading apart over time. This pattern typically forms during a downtrend and signals increasing volatility as sellers and buyers push prices to lower lows and lower highs within the wedge.
The lower trendline connects a series of lower lows, while the upper trendline connects lower highs, creating a broadening, expanding shape. Unlike most continuation patterns, the descending broadening wedge often acts as a reversal pattern, with a higher probability of breaking upward.
Traders look for a decisive break above the upper trendline, which may indicate a shift in momentum from bearish to bullish. This breakout is often accompanied by increased volume, confirming the potential for a trend reversal.
It's important to be cautious of false breakouts, so traders should use additional confirmation signals and risk management strategies, such as stop-loss orders, when trading this pattern.
Recognizing the descending broadening wedge can help traders anticipate potential reversals and adjust their strategies accordingly, especially in volatile markets.
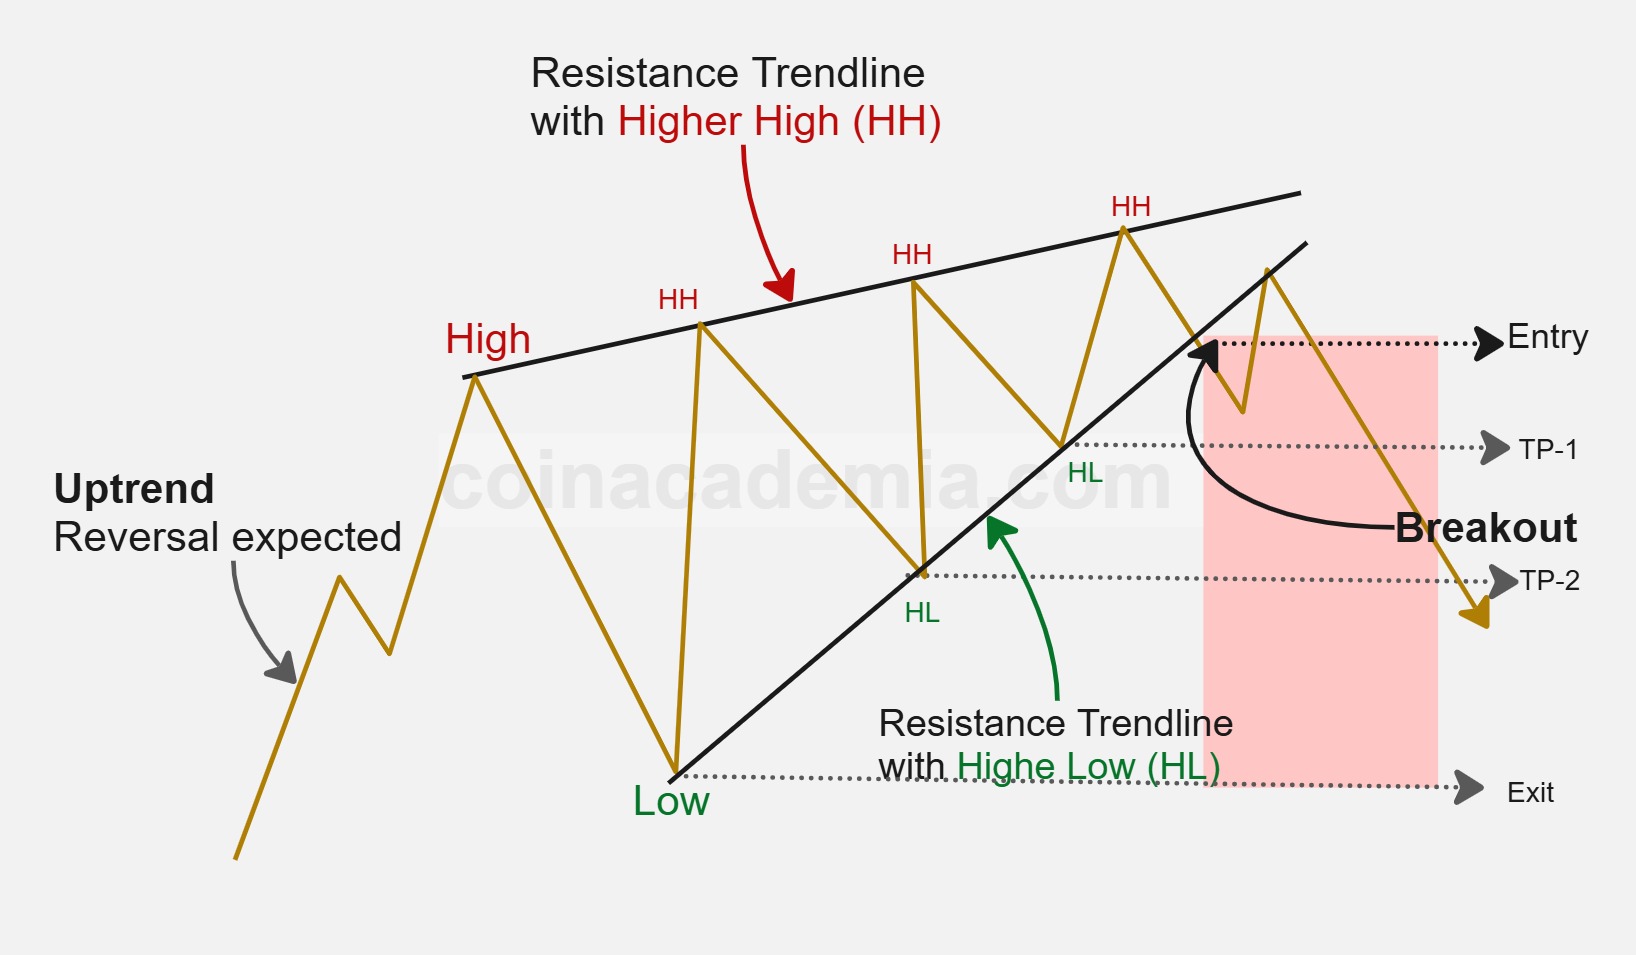
Ascending Broadening Wedge
An ascending broadening wedge is a chart pattern formed by two diverging trendlines, both sloping upward but spreading apart over time. This pattern typically appears during an uptrend and signals increasing volatility as buyers and sellers push prices to new highs and lows within the wedge.
The upper trendline connects a series of higher highs, while the lower trendline connects higher lows, creating a broadening, expanding shape. Unlike most continuation patterns, the ascending broadening wedge often acts as a reversal pattern, with a higher probability of breaking downward.
Traders watch for a decisive break below the lower trendline, which may indicate a shift in momentum from bullish to bearish. This breakdown is often accompanied by increased volume, confirming the potential for a trend reversal.
It's important to note that false breakouts can occur, so traders should use additional confirmation signals and risk management strategies, such as stop-loss orders, when trading this pattern.
Recognizing the ascending broadening wedge can help traders anticipate potential reversals and adjust their strategies accordingly, especially in volatile markets.
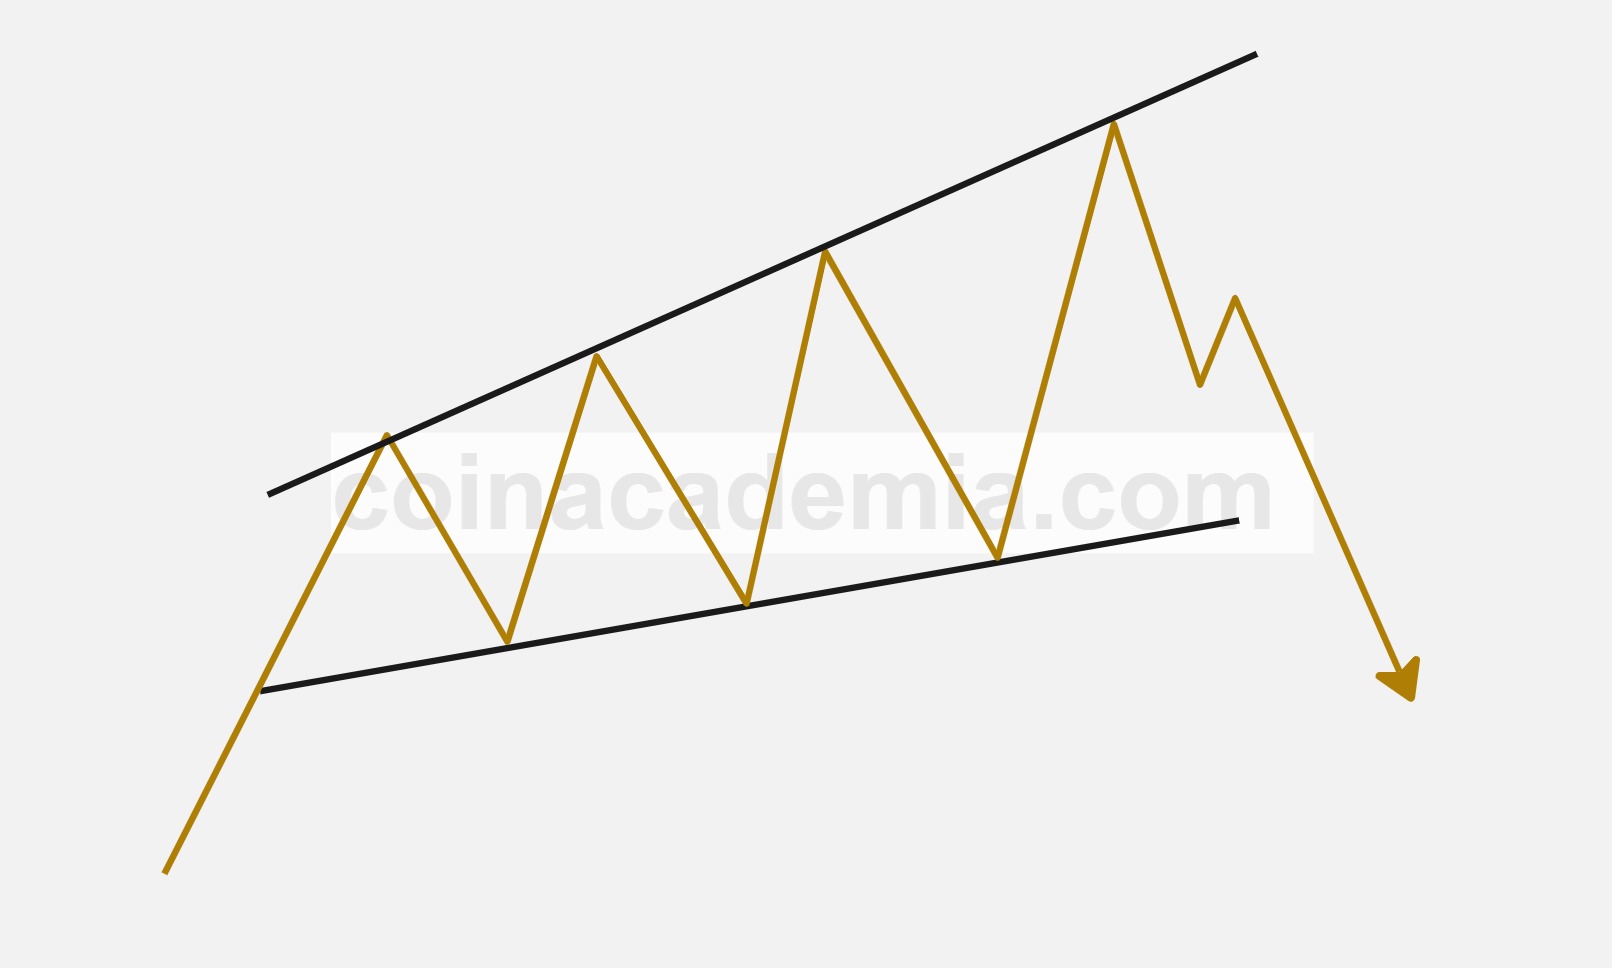
Rising Wedge - Uptrend
A rising wedge is a chart pattern formed by two upward-sloping trendlines that converge as the price moves higher. In the context of an uptrend, a rising wedge is typically considered a bearish reversal pattern. As the price rises, the range narrows, indicating weakening momentum and potential exhaustion of buyers.
Bearish results are expected when the price breaks down below the lower trendline of the wedge, often accompanied by increased volume. This breakdown signals a potential shift from bullish to bearish sentiment, and traders may anticipate a downward move or trend reversal.
Key characteristics of a bearish rising wedge include converging trendlines, declining volume as the pattern develops, and a decisive breakdown below support. Traders often wait for confirmation of the breakdown before entering short positions and use stop-loss orders above the upper trendline to manage risk.
Recognizing the bearish implications of a rising wedge in an uptrend can help traders prepare for potential reversals and protect profits in trending markets.
Rising Wedge - Uptrend
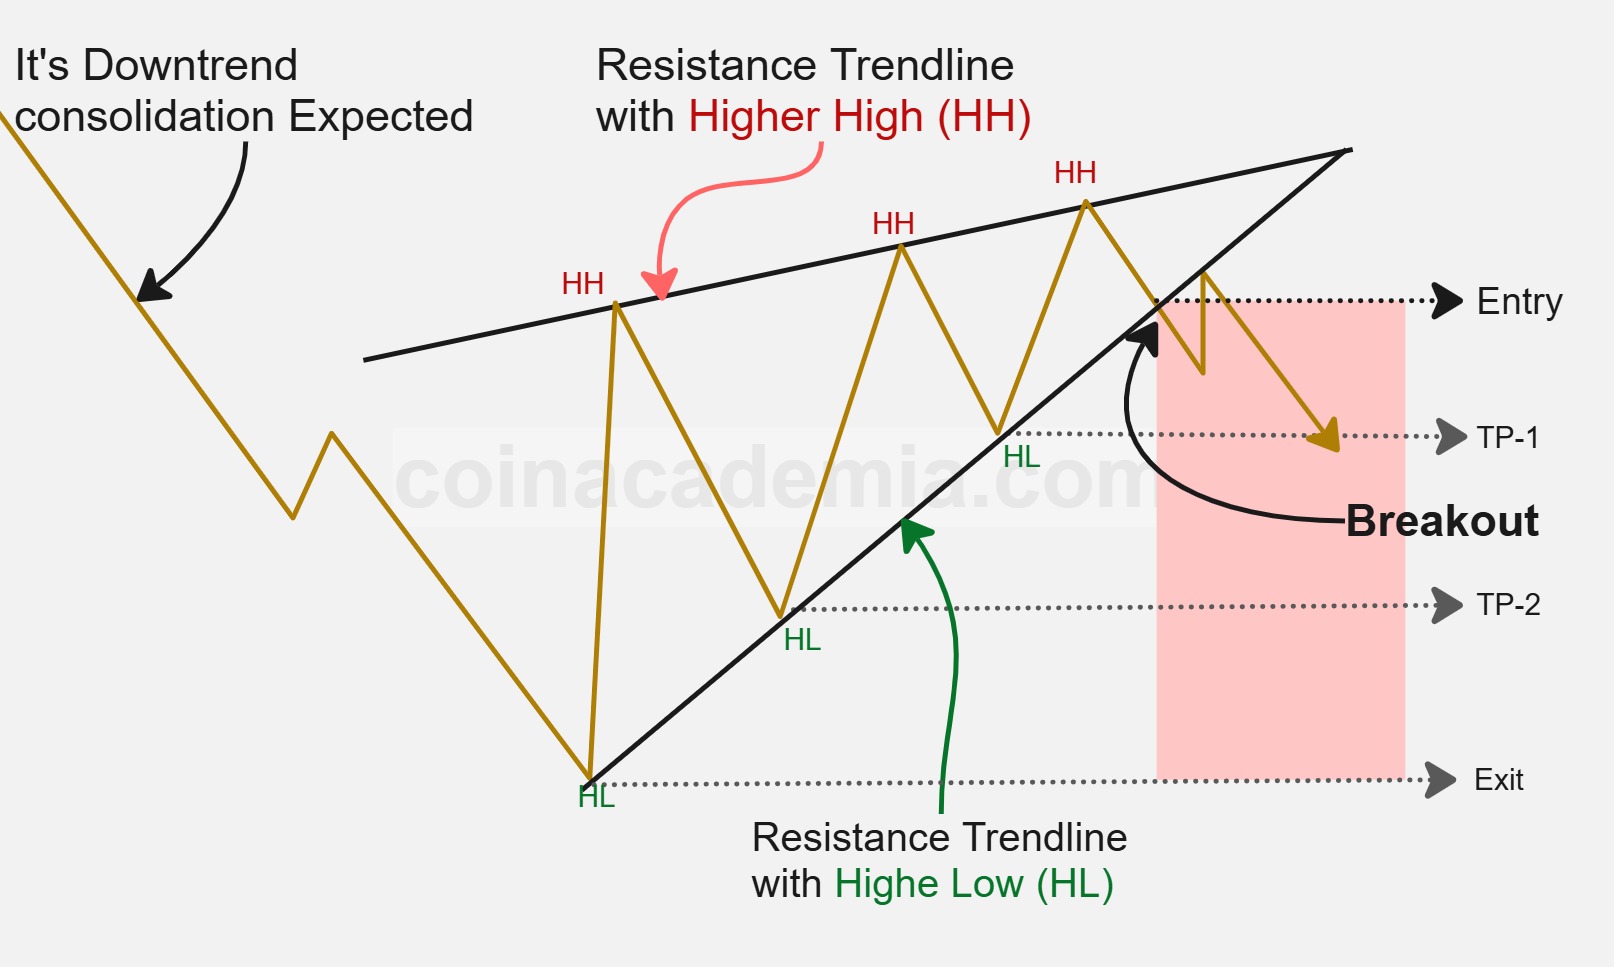
A rising wedge in a downtrend is a chart pattern formed by two upward-sloping, converging trendlines during a bearish market move. This pattern typically acts as a continuation pattern, suggesting that the prevailing downtrend is likely to resume after a temporary consolidation.
Bearish results are expected when the price breaks down below the lower trendline of the wedge, often accompanied by increased volume. This breakdown signals a continuation of the bearish momentum, and traders may anticipate further downward movement.
Key characteristics of a rising wedge in a downtrend include converging trendlines, declining volume as the pattern develops, and a decisive breakdown below support. Traders often wait for confirmation of the breakdown before entering short positions and use stop-loss orders above the upper trendline to manage risk.
Recognizing the rising wedge as a bearish continuation pattern in a downtrend can help traders position themselves for potential further declines and manage their trades effectively.
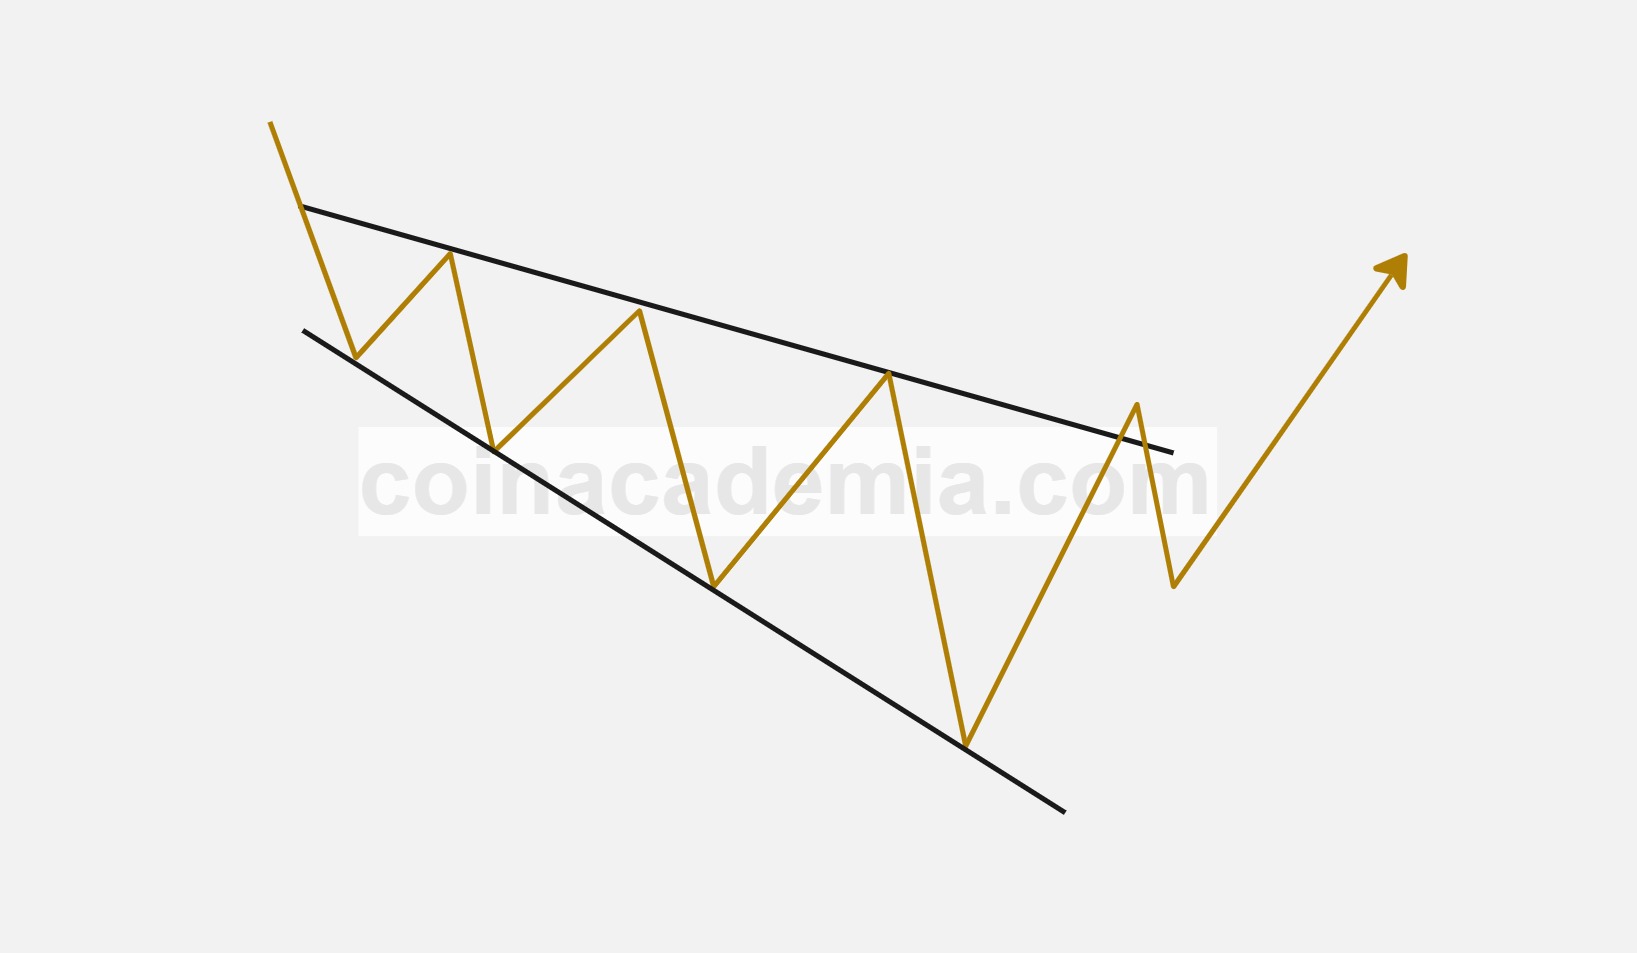
Falling Wedge - Uptrend
A falling wedge is a chart pattern formed by two downward-sloping, converging trendlines that contain the price action. In the context of an uptrend, a falling wedge is typically considered a bullish continuation pattern. As the price consolidates within the narrowing range, selling pressure diminishes and buyers gradually regain control.
Bullish results are expected when the price breaks out above the upper trendline of the wedge, often accompanied by increased volume. This breakout signals a potential continuation of the uptrend, and traders may look for long opportunities or trend-following setups.
Key characteristics of a bullish falling wedge in an uptrend include converging trendlines, declining volume as the pattern develops, and a decisive breakout above resistance. Traders often wait for confirmation of the breakout before entering positions and use stop-loss orders below the lower trendline to manage risk.
Recognizing the falling wedge in an uptrend helps traders anticipate further bullish movement and adjust their strategies accordingly.
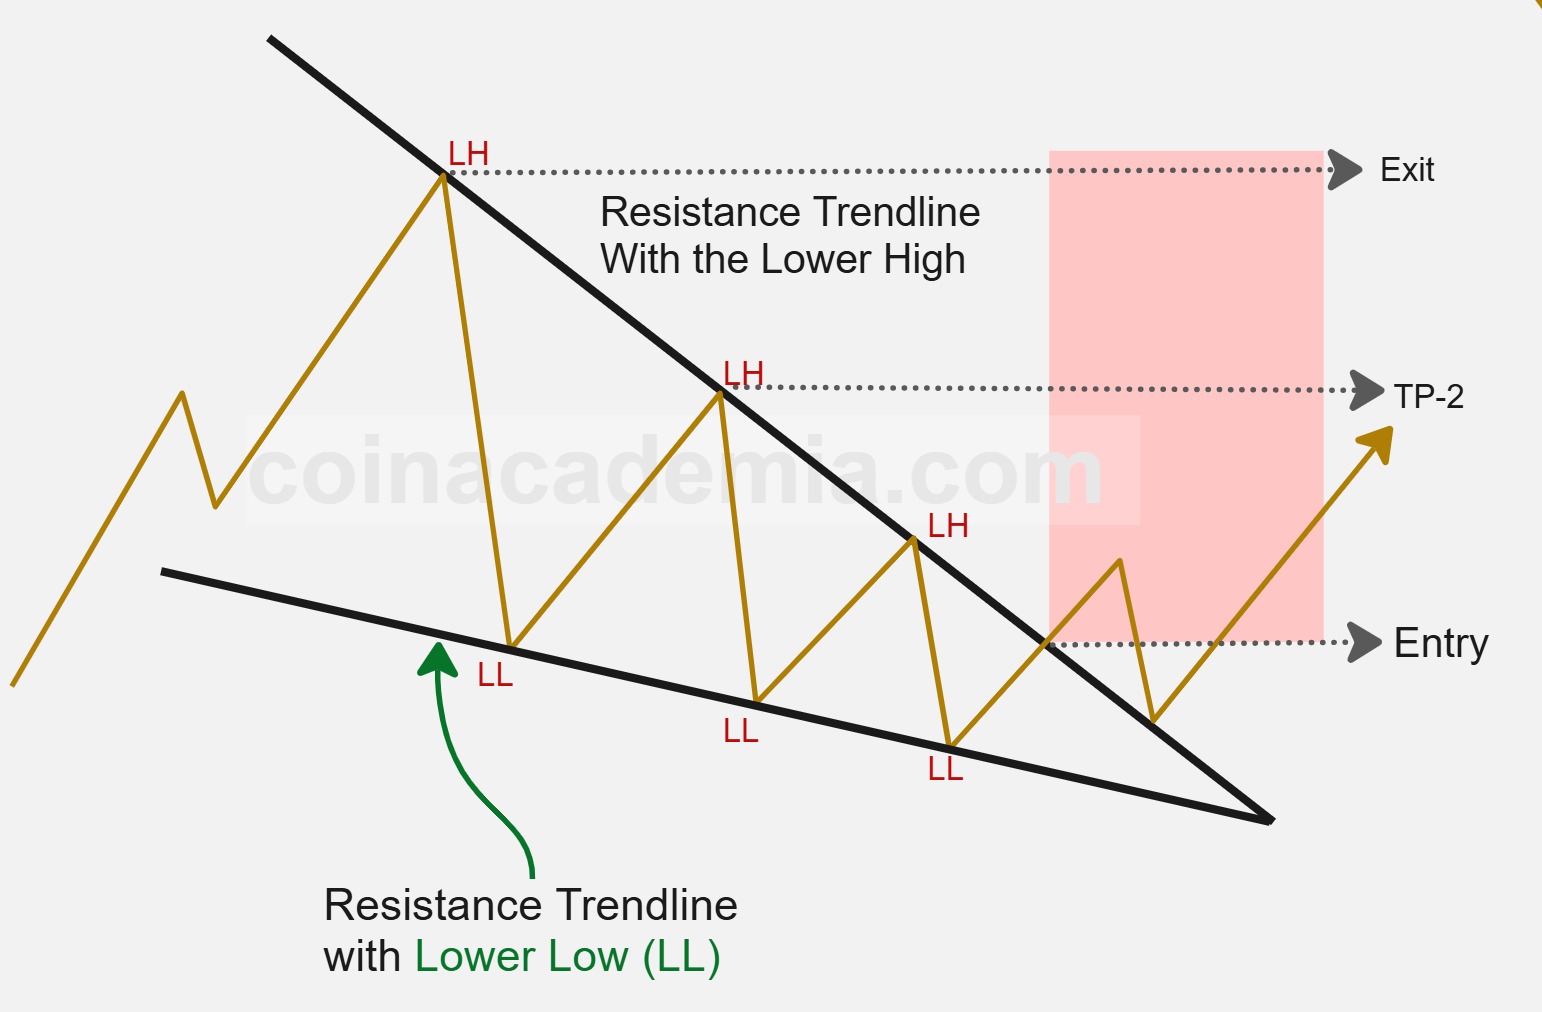
Falling Wedge - Downtrend
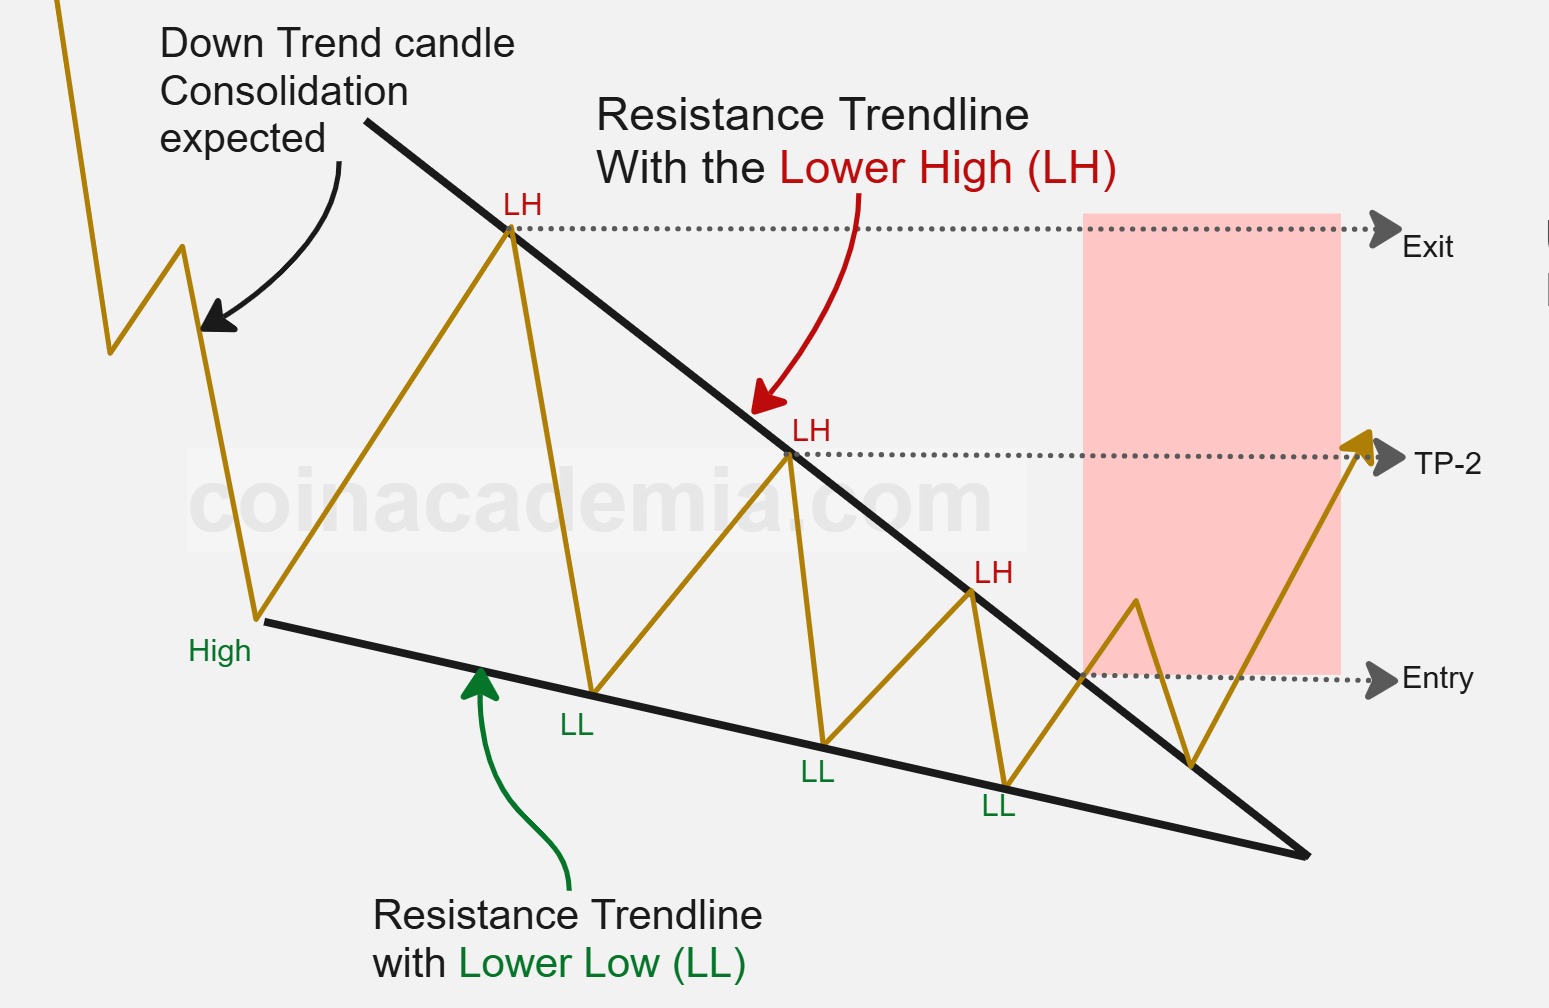
A falling wedge in a downtrend is a chart pattern formed by two downward-sloping, converging trendlines that contain the price action. This pattern typically acts as a bullish reversal pattern, suggesting that the prevailing downtrend may be losing momentum and a potential reversal to the upside is imminent.
Bullish results are expected when the price breaks out above the upper trendline of the wedge, often accompanied by increased volume. This breakout signals a potential shift in sentiment from bearish to bullish, and traders may anticipate a reversal or upward movement.
Key characteristics of a falling wedge in a downtrend include converging trendlines, declining volume as the pattern develops, and a decisive breakout above resistance. Traders often wait for confirmation of the breakout before entering long positions and use stop-loss orders below the lower trendline to manage risk.
Recognizing the falling wedge as a bullish reversal pattern in a downtrend can help traders position themselves for potential upward movement and adjust their strategies accordingly.
See All Chart-PatternsAbout Us
Coin Academia is dedicated to providing the best resources for forex and cryptocurrency education and trading.


© 2025 Coin Academia. All rights reserved.